County-by-County Breakdown of 2014 Turnout

Independents Add Two Thirds of New Votes in 2014; Turnout Rates in NC Counties Range Widely

Democrats, seniors, women and African Americans all increased their rate of participation in 2014 compared to the last midterm election in 2010, but the biggest share of new voters came from independents unaligned with any political party, according to an analysis of new data from the State Board of Elections by the nonpartisan voting rights group Democracy North Carolina.

Overall, 44.3% of registered voters cast ballots in 2014, up slightly from 43.7% in 2010. Most subgroups – but not all – experienced higher rates of participation. For example, the turnout rate among registered Democrats climbed 1.4 percentage points, from 44.7% to 46.1%, while the rate held steady for registered Republicans at 50.5% in both 2010 and 2014.

African Americans increased their turnout rate by 1.6 percentage points, compared to a gain of 1.2 points for whites and 0.5 points for Hispanics.

Unaffiliated voters are typically less engaged in midterm elections and only 35.1% bothered to vote in 2014, but that was an important increase over the 33.0% rate in 2010 because of the surging number of voters who are choosing not to affiliate with a party.

A total of 237,600 more people voted in 2014 than in 2010 and two out of three or 67% were unaffiliated voters, according to Democracy NC’s analysis.

Full numbers:
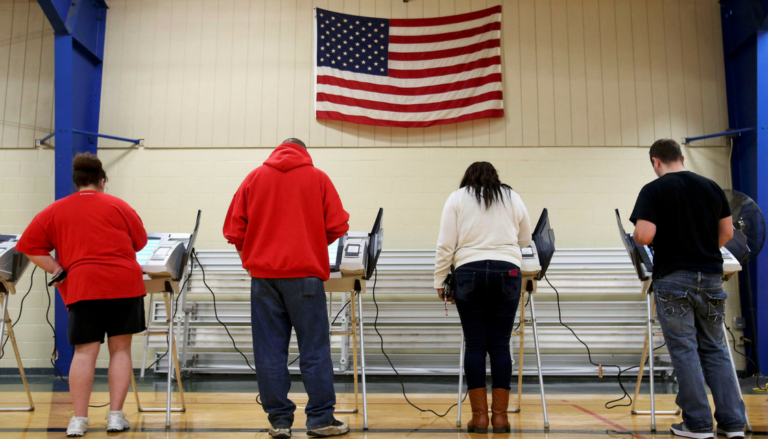
County-by-County 2014 Election Turnout

Take a look at the wide range of turnout across North Carolina counties during 2014 midterms.

Even though Democratic women increased their rate of participation from 45.1% in 2010 to 47.5% in 2014, they still lagged behind the 51.5% turnout of Republican men, which actually declined from 51.8% in 2010. Given the modest shifts in the votes from party loyalists, the independent voter played a crucial part in the ultimate outcome of the U.S. Senate race.

“Senator Kay Hagan benefitted from the increased turnout of Democratic women and African Americans, but Thom Tillis gained the edge from independent voters, conservative Democrats and the higher turnout of Republican voters,” said Bob Hall, director of Democracy NC.

On the other hand, in the nonpartisan elections, all three Democrats running for seats on the NC Supreme Court won, including African-American Justice Cheri Beasley, perhaps because the loss of straight-party voting made voters focus more on their contest-by-contest choices.

Hall noted that no party or group can be proud of an election where more than half the registered voters did not participate. He also said the new voting rules and the confusion they caused for voters and election administrators reduced overall participation by 30,000 or more voters. Read Democracy NC’s report about blocked voters.

“The loss of same-day registration cut out at least 20,000 voters,” he said, “and the end of straight-party voting and out-of-precinct voting created long lines and enormous problems that pushed away thousands of more people.”


“The loss of same-day registration cut out at least 20,000 voters and the end of straight-party voting and out-of-precinct voting created long lines and enormous problems that pushed away thousands of more people.”” –Bob Hall, Democracy NC

Hall said that Democracy North Carolina, the NC NAACP, Common Cause, the League of Women Voters, and other groups mounted yearlong campaigns to educate voters about the new voting rules, especially underrepresented and low-turnout voters.

He credits those efforts in part for the increased turnout for African Americans and the slight increase for young voters, age 18 to 25. But the 17.8% rate for youth was still less than one third the 63.3% rate for seniors over age 65.

The turnout rate of voters varied widely among the state’s 100 counties, from a high of 60.0% in Alleghany County in the mountains to a low of 32.7% in Onslow County on the coast.

The top ten counties for turnout were:

ALLEGHANY – 60.0%

YANCEY – 59.3%

CHATHAM – 58.9%

PAMLICO – 57.6%

BEAUFORT – 54.9%

TRANSYLVANIA – 54.6%

JONES – 54.1%

GRAHAM – 53.7%

WASHINGTON – 52.7%

ASHE – 52.6%

The bottom ten counties for turnout were:

ANSON – 39.3%

PITT – 39.1%

HARNETT – 39.1%

MECKLENBURG – 39.0%

WATAUGA – 37.6%

CUMBERLAND – 37.4%

PASQUOTANK – 36.3%

HOKE – 34.6%

ROBESON – 33.8%

ONSLOW – 32.7%

The counties with the biggest jump in voter participation from 2010 to 2014 were Scotland (increase of 8.7 percentage points), Guilford (6.0 points), Pamlico (6.0 points), Ashe (5.3 points), Halifax (5.3 points), and Hyde (5.3 points).

The counties with the biggest decrease in voter turnout from 2010 to 2014 were Northampton    (-8.1 percentage points), Graham (-6.0 points), Macon (-5.5 points), Clay (-5.4 points) and McDowell (-5.4 points).

In 42 counties, turnout among white Democrats exceeded white Republicans. In Wake County, the 58.5% rate for white Democrats versus 56.3% for white Republicans helped Democrats sweep the county commissioner contests and defeat Rep. Tom Murry.

The margin was even larger in Buncombe County, where 54.2% of white Democrats voted compared to 50.4% of white Republicans – and two GOP House members lost re-election, Tim Moffitt and Nathan Ramsey.

Guilford County, home of Kay Hagan, had the largest turnout increase of the major urban counties, jumping from 40.1% in 2010 to 46.1% in 2014, but the 57.8% turnout of Republican women far exceeded the 48.2% rate for Democratic women.

Mecklenburg County was again last among the state’s four biggest metro counties, with only a 39.0% turnout rate, a 1 point gain over 2010’s 38.0% rate.