Reflecting the high voter enthusiasm seen nationwide, the 2018 Election garnered unusually robust turnout from North Carolina voters for a midterm election cycle.1 In particular, the cycle brought surges in young voters, Asian American voters, Hispanic or Latino voters and unaffiliated voters, and strong opposition to the photo ID constitutional amendment in urban counties and in counties with a majority of Black registered voters. Turnout lagged in some of the counties most impacted by Hurricane Florence, suggesting that election officials must adapt their outreach and education strategies in areas vulnerable to hurricanes in order to avoid ongoing disenfranchisement in those communities. And, unless current laws change, North Carolina voters will face additional barriers to participation in 2020, including a strict photo ID requirement and the elimination of the consistently high-traffic final Saturday of Early Voting.
According to data from the North Carolina State Board of Elections, 3.75 million voters cast ballots in the 2018 General Election, for a statewide turnout rate of 53% in 2018, compared to 44% in 2014.2 The number of ballots cast in the 2018 General Election increased 28% from the 2.94 million cast in 2014. The showing is especially impressive given that, unlike 2014, the 2018 Election had no statewide U.S. Senate campaign at the top of the ballot to drive voter turnout, and registered voters only grew 7% since 2014. For context, 2018 turnout still fell far short of Presidential election cycles— in 2016, 4.77 million North Carolinians cast ballots, for a turnout rate of 69%.3
This report will examine changes in voter turnout and vote share across demographic and geographic lines in 2018, as compared to the last midterm election in 2014. Voter turnout refers to the percentage of registered voters who cast ballots. Vote share is the percentage of all votes cast by a certain group and demonstrates more clearly than turnout how the pool of voters is shifting over time. For example, as seen below, youth (voters 18 to 25) not only had higher voter turnout rates compared to 2014, but they also made up a greater share of the ballots cast this year.
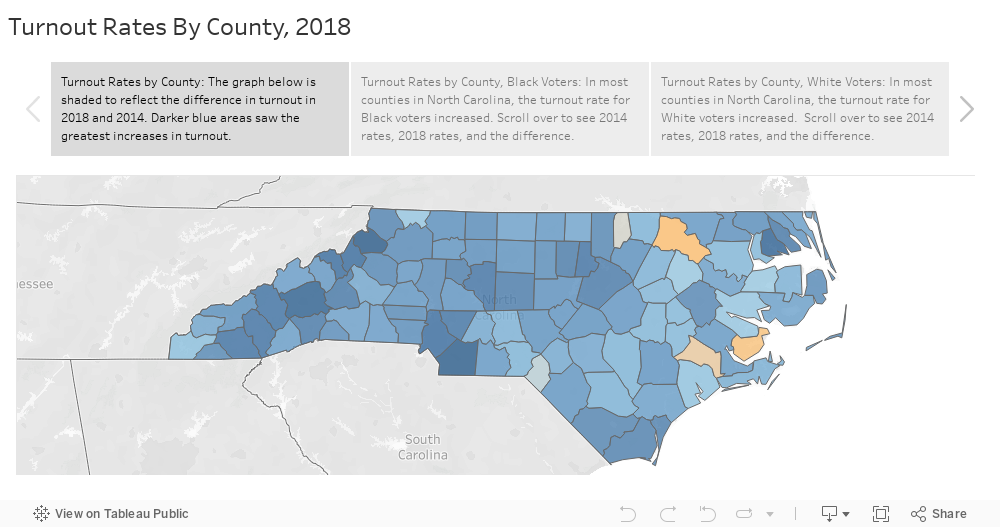
Turnout is the percentage of registered voters who cast ballots in a given election. Counties are shaded based on the difference between the turnout rate in 2018 and 2014. The first graph reflects all voters, while the second looks at black voters, then the third looks white voters. See more detail below on turnout rates and race and ethnicity. Blue counties saw higher turnout rates, while orange counties saw lower turnout rates. Scroll over the map to find your county.
As represented in the map above, almost every county saw an increase in the turnout rate this year, with notable exceptions in some of the counties hardest hit by Hurricane Florence.
-
- Chatham County had the highest turnout rate in 2018, with 67% of voters casting ballots. Alleghany, Ashe, Buncombe, Clay, Transylvania, and Yancey also had turnout rates of 60% or higher.
- Four out of the five counties with the lowest turnout rates in 2018 (Cumberland, Halifax, Hoke, Onslow, Robeson) received federal assistance after Hurricane Florence.4 In Onslow County, which had the lowest turnout rate in the state in 2018, only 35% of registered voters cast ballots, but it was a slight improvement from 2014’s 33% turnout rate. Halifax County did not receive federal assistance after Hurricane Florence, but it had only one Early Voting site this year compared to three Early Voting sites in 2014 and 2016, due to constraints imposed by the legislature in Senate Bill 325.5
- Only three counties in North Carolina saw a decrease in the turnout rate (the percentage of registered voters who cast ballots) compared to 2014– Halifax, Jones, and Pamlico. All three decreased only slightly below 2014 levels. Both Jones and Pamlico received federal assistance after Hurricane Florence, while Halifax, as mentioned above, had fewer Early Voting sites than in previous cycles.
Voting Method
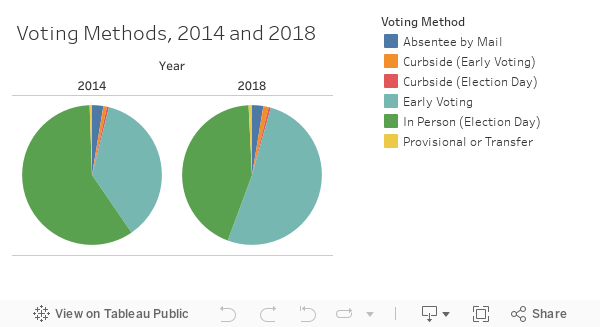
The majority of North Carolinians, 51% (1.9 million voters), voted in person during Early Voting, while 44% (1.6 million) cast their ballots in person on Election Day. A much greater share of voters statewide utilized Early Voting in 2018 (51%) than in 2014 (37%). Notably, the 2014 Early Voting cycle was only 10 days, while 2018’s was over a week longer at 18 days. Other voting methods made up about the same share in 2018 as in 2014, with slight upticks in the share of voters who cast ballots curbside during Early Voting and in the share of voters who cast ballots provisionally.
Statewide Trends, by Race and Ethnicity
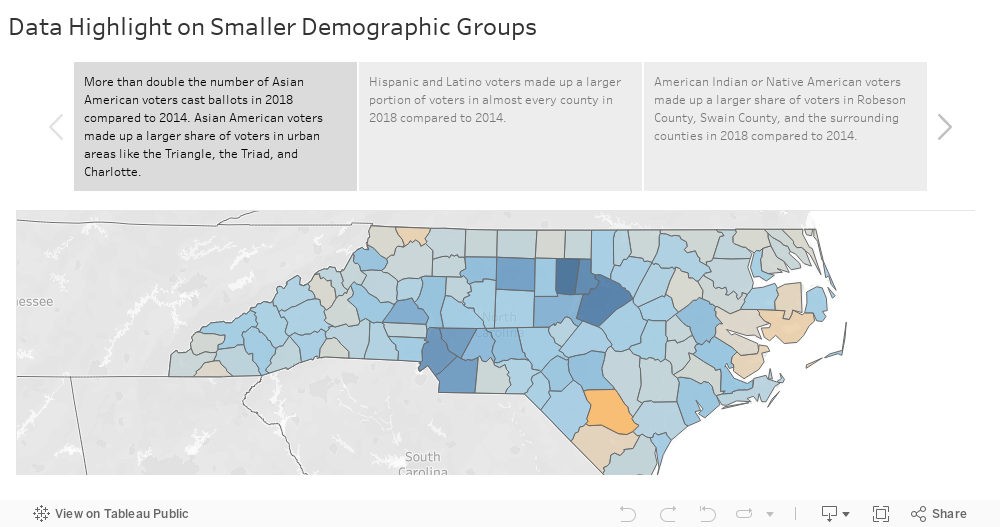
Above, see data highlights on Asian American voters, Hispanic or Latino voters, and American Indian or Native American voters.
Voter turnout increased across racial and ethnic groups, with especially significant increases for Asian American voters, although this group accounts for only 1% of all registered voters in North Carolina.6 Vote share provides additional context about the impact of smaller demographic groups, particularly at the local level, since it speaks directly to how many ballots were cast by which groups of voters.
- 25% more White voters cast ballots in 2018 (2,723,832) than in 2014 (2,186,541). The turnout rate for White voters in the 2018 election (ballots cast divided by registered voters) was 56% in 2018, up from 47% in 2014.
- The number of Black voters who voted in 2018 (753,229), increased by 20% compared to 2014 (629,059), despite only 4% growth in the total number of Black voter registrations at that time. The turnout rate for all Black voters in the 2018 election (ballots cast divided by registered voters) was up six percentage points (48% in 2018, up from 42% in 2014), while the turnout rate for Black women was slightly higher–up seven percentage points from 46% in 2014, to 53% in 2018.
- More than double the number of Asian American voters cast ballots in NC in 2018 (40,982) than in 2014 (17,412).The number of Asian American registered voters has increased 44% since 2014, and their turnout rate in the 2018 election (ballots cast divided by registered voters) was 44% in 2018 — up 17 percentage points from 27% in 2014.
- The number of Native American or American Indian voters who cast ballots in 2018 (21,977) increased 41% compared to 2014 (15,629), despite only an 8% growth in voter registrations. The turnout rate for Native American or American Indian voters in the 2018 election (ballots cast divided by registered voters) was 38% in 2018, up nine percentage points from 29% in 2014.
- Almost double the number of Multiracial voters cast ballots in 2018 (18,759) compared to 2014 (9,711). The turnout rate for Multiracial voters in the 2018 election (ballots cast divided by registered voters) was 39% in 2018, up 14 percentage points from 25% in 2014.
- Hispanic or Latino voters cast 68,949 ballots this year, two and a half times the 26,036 ballots cast by Hispanic or Latino voters in 2014. Turnout for Hispanic or Latino voters increased by 15 points: 35% of registered Hispanic or Latino voters cast ballots in 2018 compared to 20% in 2014.
Statewide Trends, by Age Group

The first map above examines changes in the turnout rate in 2018 compared to 2014, which is the percent of 18 to 25 year old registered voters that cast ballots. The second graph looks at changes in vote share, which allows us to see how demographic changes are shifting the voter pool over time.
Turnout increased among North Carolinians of all ages, but the most dramatic changes occurred among younger voters.
- Voters 66 or older were the most likely to cast their ballots (68% turnout in 2018 compared to 63% turnout in 2014), followed by registered 41-65 year olds, 61% of whom voted this year, compared to 52% in 2014.
- Younger voters had lower turnout rates than older voters, but the greatest increases in turnout. Voter turnout of 25 to 40 year olds increased by 10 points (39% voted this year, compared to 29% in 2014). Turnout of 18 to 25 year olds increased by 11 points, with 29% voting this year compared to 18% in 2014.
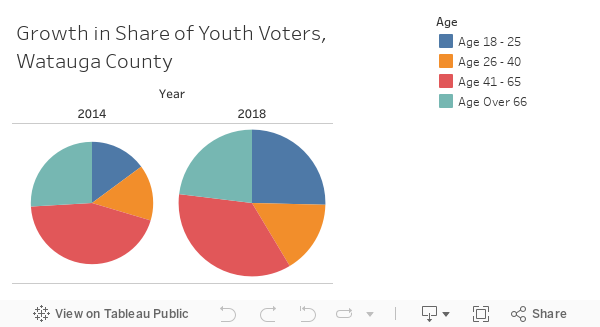
The trend was especially dramatic in Watauga County, home of Appalachian State University. As seen in the charts, not only did the number of voters grow in 2018 (the size of the pie), but youth made up 25% of voters in 2018, compared to just 15% in 2014. The vote share of 26-40 year old voters was also slightly greater in 2018 than in 2014.
- Buncombe, Chatham, Graham, Orange, and Yancey saw the highest turnout rates for 18-25 year old voters, while the greatest number of 18-25 year olds cast ballots in Durham, Forsyth, Guilford, Mecklenburg, and Wake.
- Jackson County and Watauga County saw the largest increases in youth turnout. In Jackson, home of Western Carolina University, 33% of 18-25 year olds voted, up 20 percentage points from 13% in 2014. In Watauga, where Appalachian State University is located, 38% of 18-25 year olds voted, up 21 percentage points from to 17% in 2014.
Statewide trends, by Party Affiliation
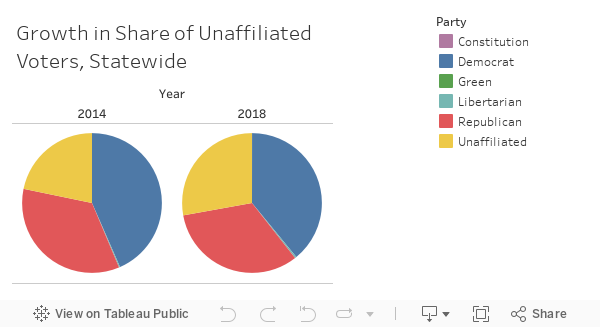
Unaffiliated voters made up a greater share of voters in 2018. The share of voters who are unaffiliated increased six percentage points from 2014 to 2018, which is reflected in a four point reduction of the vote share held by Democrats and a two point reduction for Republicans.
- Across the state, Democrats, Republicans, and unaffiliated voters cast over a million ballots each.
- Turnout rates for Democrats (55%), Republicans (58%), and Libertarians (36%) all exceeded 2014 turnout rates by eight percentage points.
- Unaffiliated voters saw the most dramatic jump, from 35% turnout in 2014 to 46% turnout in 2018. In that time, the number of registered unaffiliated voters grew by 24%; there are currently 2.25 million registered unaffiliated voters. More than double the number of 18 to 25 year old unaffiliated voters cast ballots in 2018 (99,656) than in 2014 (46,033).
- Two additional party affiliations were recognized this year: the Constitution Party and the Green Party. In the 2018 General, 331 of the Constitution Party’s 587 registered voters cast ballots, as did 490 of the Green Party’s 811 registered voters.
Constitutional Amendment Results, by County
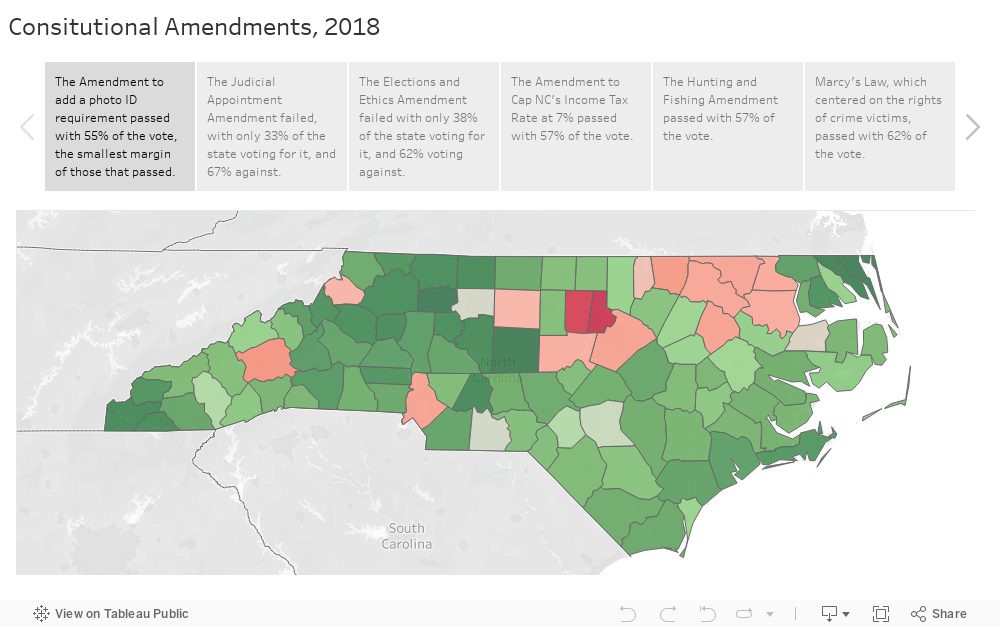
As seen above, two of the amendments on the ballot failed, while four passed. Green indicates support for the amendment in question, while red indicates opposition.
Six constitutional amendments were on the ballot this year, and became a focal point for many voters in a “blue moon” election year with few high profile races. Two were soundly defeated: one of which would have given the legislature a greater role in selecting judges, and another which would have expanded the legislature’s control over the State Board of Elections. An amendment to add a photo ID requirement for voting to the state constitution narrowly passed.7
- As seen in the maps above, opposition to the amendments was largely centered in urban areas (especially Buncombe, Chatham, Durham, Forsyth, Guilford, Mecklenburg, Orange and Wake counties), and in a handful of rural counties.
- There are only eight counties in North Carolina where a majority of registered voters are Black–all in the Northeast part of the state–and all eight voted against the photo ID requirement (Hertford, Bertie, Edgecombe, Northampton, Halifax, Vance, Warren, and Washington).
In the West, Watauga County stood out among its neighbors in opposition to the amendments, likely due in large part to the Appalachian State University community and the surge of young voters in Watauga this year.
1 Stewart, E. (2018, Nov 19). 2018’s record-setting voter turnout, in one chart. Vox. Retrieved from https://www.vox.com/policy-and-politics/2018/11/19/18103110/2018-midterm-elections-turnout.
2 Note: Our analysis is based on the data available from the State Board of Elections as of January 2019. Not all races have been certified, and investigations into absentee ballot use in Congressional District 9 are ongoing at this time.
3 For more information on 2016 turnout, see Hall, B. (2017, Jan. 26) Analysis: Who Voted in 2016 & Who Didn’t. Democracy North Carolina. Retrieved from https://democracync.org/wp-content/uploads/2017/05/WhoVoted2016.pdf
4 North Carolina Office of the Governor. (2018, Sept 28). Green Becomes 28th County Eligible for Florence Disaster Assistance. Retrieved from https://governor.nc.gov/news/greene-becomes-28th-county-eligible-florence-disaster-assistance
5 Weber, J. (2018, July 18). New state law will mean fewer places to vote early in some counties. The News & Observer. Retrieved from https://www.newsobserver.com/news/politics-government/article214589500.html
6 To learn more about Asian American Voters in North Carolina, see North Carolina Asian Americans Together (NCAAT). (October 2018). How Asian American voters are changing NC. Retrieved from http://ncaatogether.org/wp-content/uploads/2018/10/2018-ncaat-demographic-report-online-11.pdf
7 As of January 2019, multiple lawsuits have been filed challenging the constitutionality of the photo ID amendment itself and the enacting legislation, S824. Democracy North Carolina is not engaged in litigation at this time, but publicly opposed all six constitutional amendments.
MEDIA CONTACT: Jen Jones, 919-260-5906, jen@democracync.org
DATA QUESTIONS/REQUESTS: Sunny Frothingham, 919-908-7941, sunny@democracync.org
Democracy North Carolina is a statewide nonpartisan organization that uses research, organizing, and advocacy to increase civic participation, reduce the influence of big money in politics, and remove systemic barriers to voting and serving in elected office.